In plain English
When you ship a normal web service, you don't fly blind. You wire in observability: traces that show how one request flowed through your code, metrics that count how often things happen, and logs that record what went wrong. The industry-standard way to emit all of that is OpenTelemetry (often shortened to OTel) — one open format that almost every monitoring tool already understands.
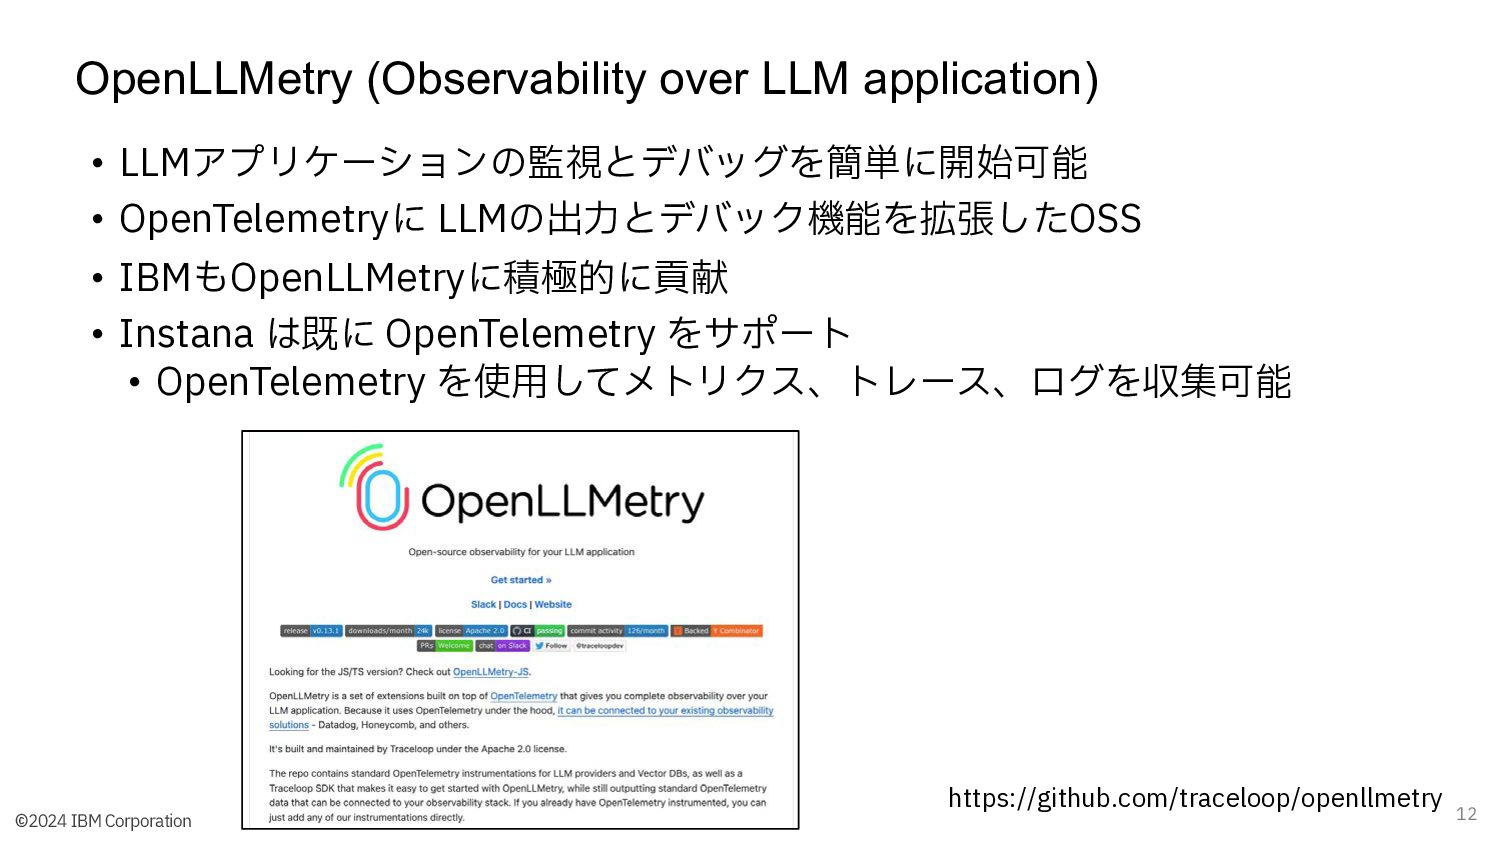
OpenLLMetry, from a company called Traceloop, is a small set of libraries that bring that same standard to LLM applications. You add a few lines at startup, and it quietly watches the calls your app makes — to Claude or another model, to a vector database, to a framework like LangChain — and turns each one into a standard OpenTelemetry span: a timed, labelled record of one operation. The name is a portmanteau: OpenTelemetry for LLMs.
Think of it like a flight recorder you bolt onto an existing aircraft. The plane (your app) flies exactly as before. The recorder simply notes every important event — what was asked, which model answered, how long it took, how many tokens it cost — in a format any control tower can read. OpenLLMetry is that recorder, and OpenTelemetry is the shared radio frequency every tower listens on.
Why it matters
An LLM app is harder to debug than ordinary code. The model is non-deterministic, a single user request can fan out into many model and tool calls, and the thing that went wrong is usually inside a prompt or a retrieved chunk you never see. Without tracing, a bug report like "the answer was wrong" gives you almost nothing to work with.
- You can see the full call, not just the result. A trace captures the exact prompt sent, the response received, the model name, the latency, and the token counts — so you can reconstruct precisely what happened on the request that misbehaved.
- Cost and latency stop being a mystery. Token usage per call rolls up into spans, so you can find the one step that is burning money or adding seconds, instead of guessing.
- Multi-step flows become legible. For a RAG pipeline or an agent loop, the trace shows the retrieve step, each model call, and each tool call nested in order — turning a black box into a timeline you can read.
So why OpenLLMetry specifically, rather than a tool's own custom SDK? Because it is built on the OpenTelemetry standard instead of a proprietary format. That single decision is what makes it valuable: the traces it emits aren't locked to one vendor's product.
The practical payoff is no lock-in. Many LLM platforms ship their own tracing SDK, and once your code is wired to it, switching tools means re-instrumenting everything. With OpenLLMetry you instrument once, in the open standard, and then point the data at whichever backend you like — and change your mind later without touching application code. If your company already runs Datadog or Grafana for the rest of its services, your LLM traces can flow into the same place as everything else.
How it works
OpenLLMetry has two jobs: capture the LLM-specific operations as OpenTelemetry spans (auto-instrumentation), and describe them with a shared vocabulary (semantic conventions). It then hands the spans to the standard OpenTelemetry pipeline, which ships them wherever you configured.
Auto-instrumentation: catching calls without rewriting them
You don't manually wrap every model call. At startup you call OpenLLMetry's initializer, and it patches the client libraries you already use — the model SDK, the vector-database client, the orchestration framework. From then on, each call to one of those libraries is automatically wrapped in a span that records the inputs, the outputs, and the timing. Your business logic stays exactly as it was; the instrumentation rides alongside it.
Semantic conventions: a shared vocabulary for LLM spans
A trace is only useful if every tool agrees on what the fields mean. OpenTelemetry defines GenAI semantic conventions — an agreed set of attribute names for AI operations, so a span always records the model name, the operation type, the prompt and completion, and token counts under the same keys no matter who emits or reads them. OpenLLMetry follows these conventions, which is exactly why its output drops cleanly into any compliant backend.
| What it captures | Example attribute (conceptual) | Why you want it |
|---|---|---|
| Which model ran | the model / system name | Compare cost and quality across models |
| Operation type | chat, embedding, tool call | Filter and group spans by kind |
| Prompt and response | the input and output text | See exactly what was asked and answered |
| Token usage | input and output token counts | Attribute cost to the specific call |
Exporting: where the standard pipeline takes over
Once a span is built and labelled, OpenLLMetry is done with the LLM-specific work. The span enters the ordinary OpenTelemetry SDK, which exports it — usually over OTLP, the OpenTelemetry wire protocol — to whatever destination you set. Because that hand-off is the standard one, switching backends is a configuration change, not a code change.
from traceloop.sdk import Traceloop
from anthropic import Anthropic

# One call wires up auto-instrumentation. The destination (Langfuse,
# Phoenix, Datadog, an OTel Collector...) is set here or via OTLP env vars
# (e.g. OTEL_EXPORTER_OTLP_ENDPOINT) — application code below is untouched.
Traceloop.init(app_name="my-llm-app")

client = Anthropic()

# This ordinary model call is now automatically traced: a span captures
# the model, the prompt, the response, latency, and token usage.
msg = client.messages.create(
    model="claude-sonnet-4-6",
    max_tokens=300,
    messages=[{"role": "user", "content": "Summarize OpenTelemetry in one line."}],
)
print(msg.content[0].text)Where it fits among observability tools
Beginners often lump every "LLM observability" name into one bucket. They actually sit at different layers. OpenLLMetry is the producer of standardized data; the dashboards are consumers of it. Keeping that split straight is the fastest way to understand the whole space.
- Lives inside your app
- Produces OpenTelemetry spans
- Vendor-neutral by design
- Not a UI — you can't 'look' at it
- Swap the backend, keep the code
- Lives outside your app
- Consumes and stores spans
- Often has its own native SDK too
- Where you actually view traces
- Swap the SDK, re-instrument the code
Tools like Langfuse, LangSmith, and Helicone each offer their own native way to capture traces. Those work well, but they tie your instrumentation to that product. The OpenLLMetry approach is the inverse: instrument in the open standard, then send to one of those tools (several of them accept OpenTelemetry data directly) — or to a general-purpose backend like Datadog or Grafana, or to an OpenTelemetry Collector that fans the data out to several destinations at once. If you want the trade-offs spelled out, see Langfuse vs LangSmith vs Helicone.
| Concern | Native tool SDK | OpenLLMetry (OTel) |
|---|---|---|
| Setup | Often one library, tightly integrated | One init call, plus an OTLP destination |
| Lock-in | Higher — code is tied to that tool | Lower — code is tied to the standard |
| Backend choice | Usually that tool only | Any OTel-compatible backend |
| Fits existing monitoring | Separate from your other services | Same pipeline as the rest of your stack |
Common pitfalls
OpenLLMetry is easy to add and easy to misunderstand. Most of the trouble comes from forgetting that it only produces data, and from not thinking about what that data contains.
- Expecting a dashboard out of the box. Initializing OpenLLMetry with no destination configured means spans are produced but never shipped anywhere you can see them. You still need to point it at a backend (or a Collector). It is the recorder, not the screen.
- Prompts and responses are sensitive data. Capturing the full input and output is the whole appeal, but those payloads can contain personal information, secrets, or proprietary text. Decide deliberately what to capture, and redact before it leaves your system if needed.
- Tracing everything at full volume. In high-traffic production, recording every single request — with full prompt bodies — gets expensive and noisy. Sampling a fraction of traffic is the standard answer; see trace sampling for LLM apps.
- Forgetting it's still plain OpenTelemetry. Because it rides the standard pipeline, the usual OTel rules apply: an exporter has to be configured, the Collector (if you use one) has to be reachable, and network or auth problems show up as 'no traces appearing' rather than an error in your app.
Going deeper
Once the basics click, a few directions are worth knowing as you move toward real production monitoring.
Workflow and task annotations. Auto-instrumentation captures individual calls, but you often want to group several of them into a named unit — "answer-question" wrapping a retrieve step plus two model calls. OpenLLMetry lets you annotate higher-level workflows and tasks so the trace reflects your app's logic, not just its raw library calls. This is what turns a flat list of spans into a readable trace of a whole agent or pipeline.
The Collector pattern. For anything beyond a single service, the common production shape is: every app exports to a central OpenTelemetry Collector, and the Collector handles batching, sampling, redaction, and fan-out to one or more backends. Because OpenLLMetry speaks plain OTLP, it slots into this pattern with no special handling — the Collector treats LLM spans like any other.
Metrics and cost attribution, not just traces. Traces answer "what happened on this one request". Aggregated metrics answer "what is happening across all requests" — and token attributes on spans roll up into cost-per-feature or cost-per-user views. This is the bridge from debugging to ongoing production metrics and cost attribution.
Where it sits in the bigger picture. Tracing is one pillar of LLM observability; the others include evaluation, user feedback, and alerting on quality. OpenLLMetry gives you the trace data; you still pair it with evals and feedback to judge whether the answers were actually good, not just fast and cheap. The durable lesson is the one behind every standards-based tool: instrument once in the open format, and you keep your freedom to change everything downstream later.
FAQ
What is OpenLLMetry?
OpenLLMetry is an open-source set of OpenTelemetry-based instrumentation libraries, from Traceloop, that automatically trace LLM applications. It captures model calls, vector-database queries, and framework operations as standard OpenTelemetry spans, so you can send LLM traces to any OpenTelemetry-compatible backend rather than being tied to one vendor's tool.
Is OpenLLMetry a monitoring dashboard?
No. OpenLLMetry produces standardized trace data; it does not display it. You view the traces in a separate backend — such as Langfuse, Arize Phoenix, Datadog, or Grafana — or route them through an OpenTelemetry Collector. Think of OpenLLMetry as the flight recorder and the backend as the screen you read it on.
How is OpenLLMetry different from OpenTelemetry?
OpenTelemetry is the general, language-agnostic standard for traces, metrics, and logs across all kinds of software. OpenLLMetry is a thin layer on top that adds auto-instrumentation for AI-specific operations (model calls, embeddings, tool calls) and follows the GenAI semantic conventions, so those operations show up as properly labelled OpenTelemetry spans.
What does 'vendor-neutral' mean for LLM tracing?
It means your instrumentation isn't locked to one product. Because OpenLLMetry emits data in the open OpenTelemetry format, you wire it into your code once and then choose — or change — the destination freely. Switching from one backend to another becomes a configuration change instead of a code rewrite.
Does OpenLLMetry capture the actual prompts and responses?
Yes — capturing the full input and output of each model call is one of its main benefits, since that is what you need to debug a bad answer. Because those payloads can contain personal or sensitive data, decide deliberately what to record and redact anything that shouldn't leave your system before it reaches a backend.