In plain English
When you build a normal web app, you can usually tell why it broke: a stack trace points at the exact line. An app built on a large language model is different. The model is a black box that returns fluent text, the same input can give different outputs, and "wrong" often means subtly wrong rather than a crash. When a user complains that your AI gave a bad answer last Tuesday, you have almost nothing to look at.
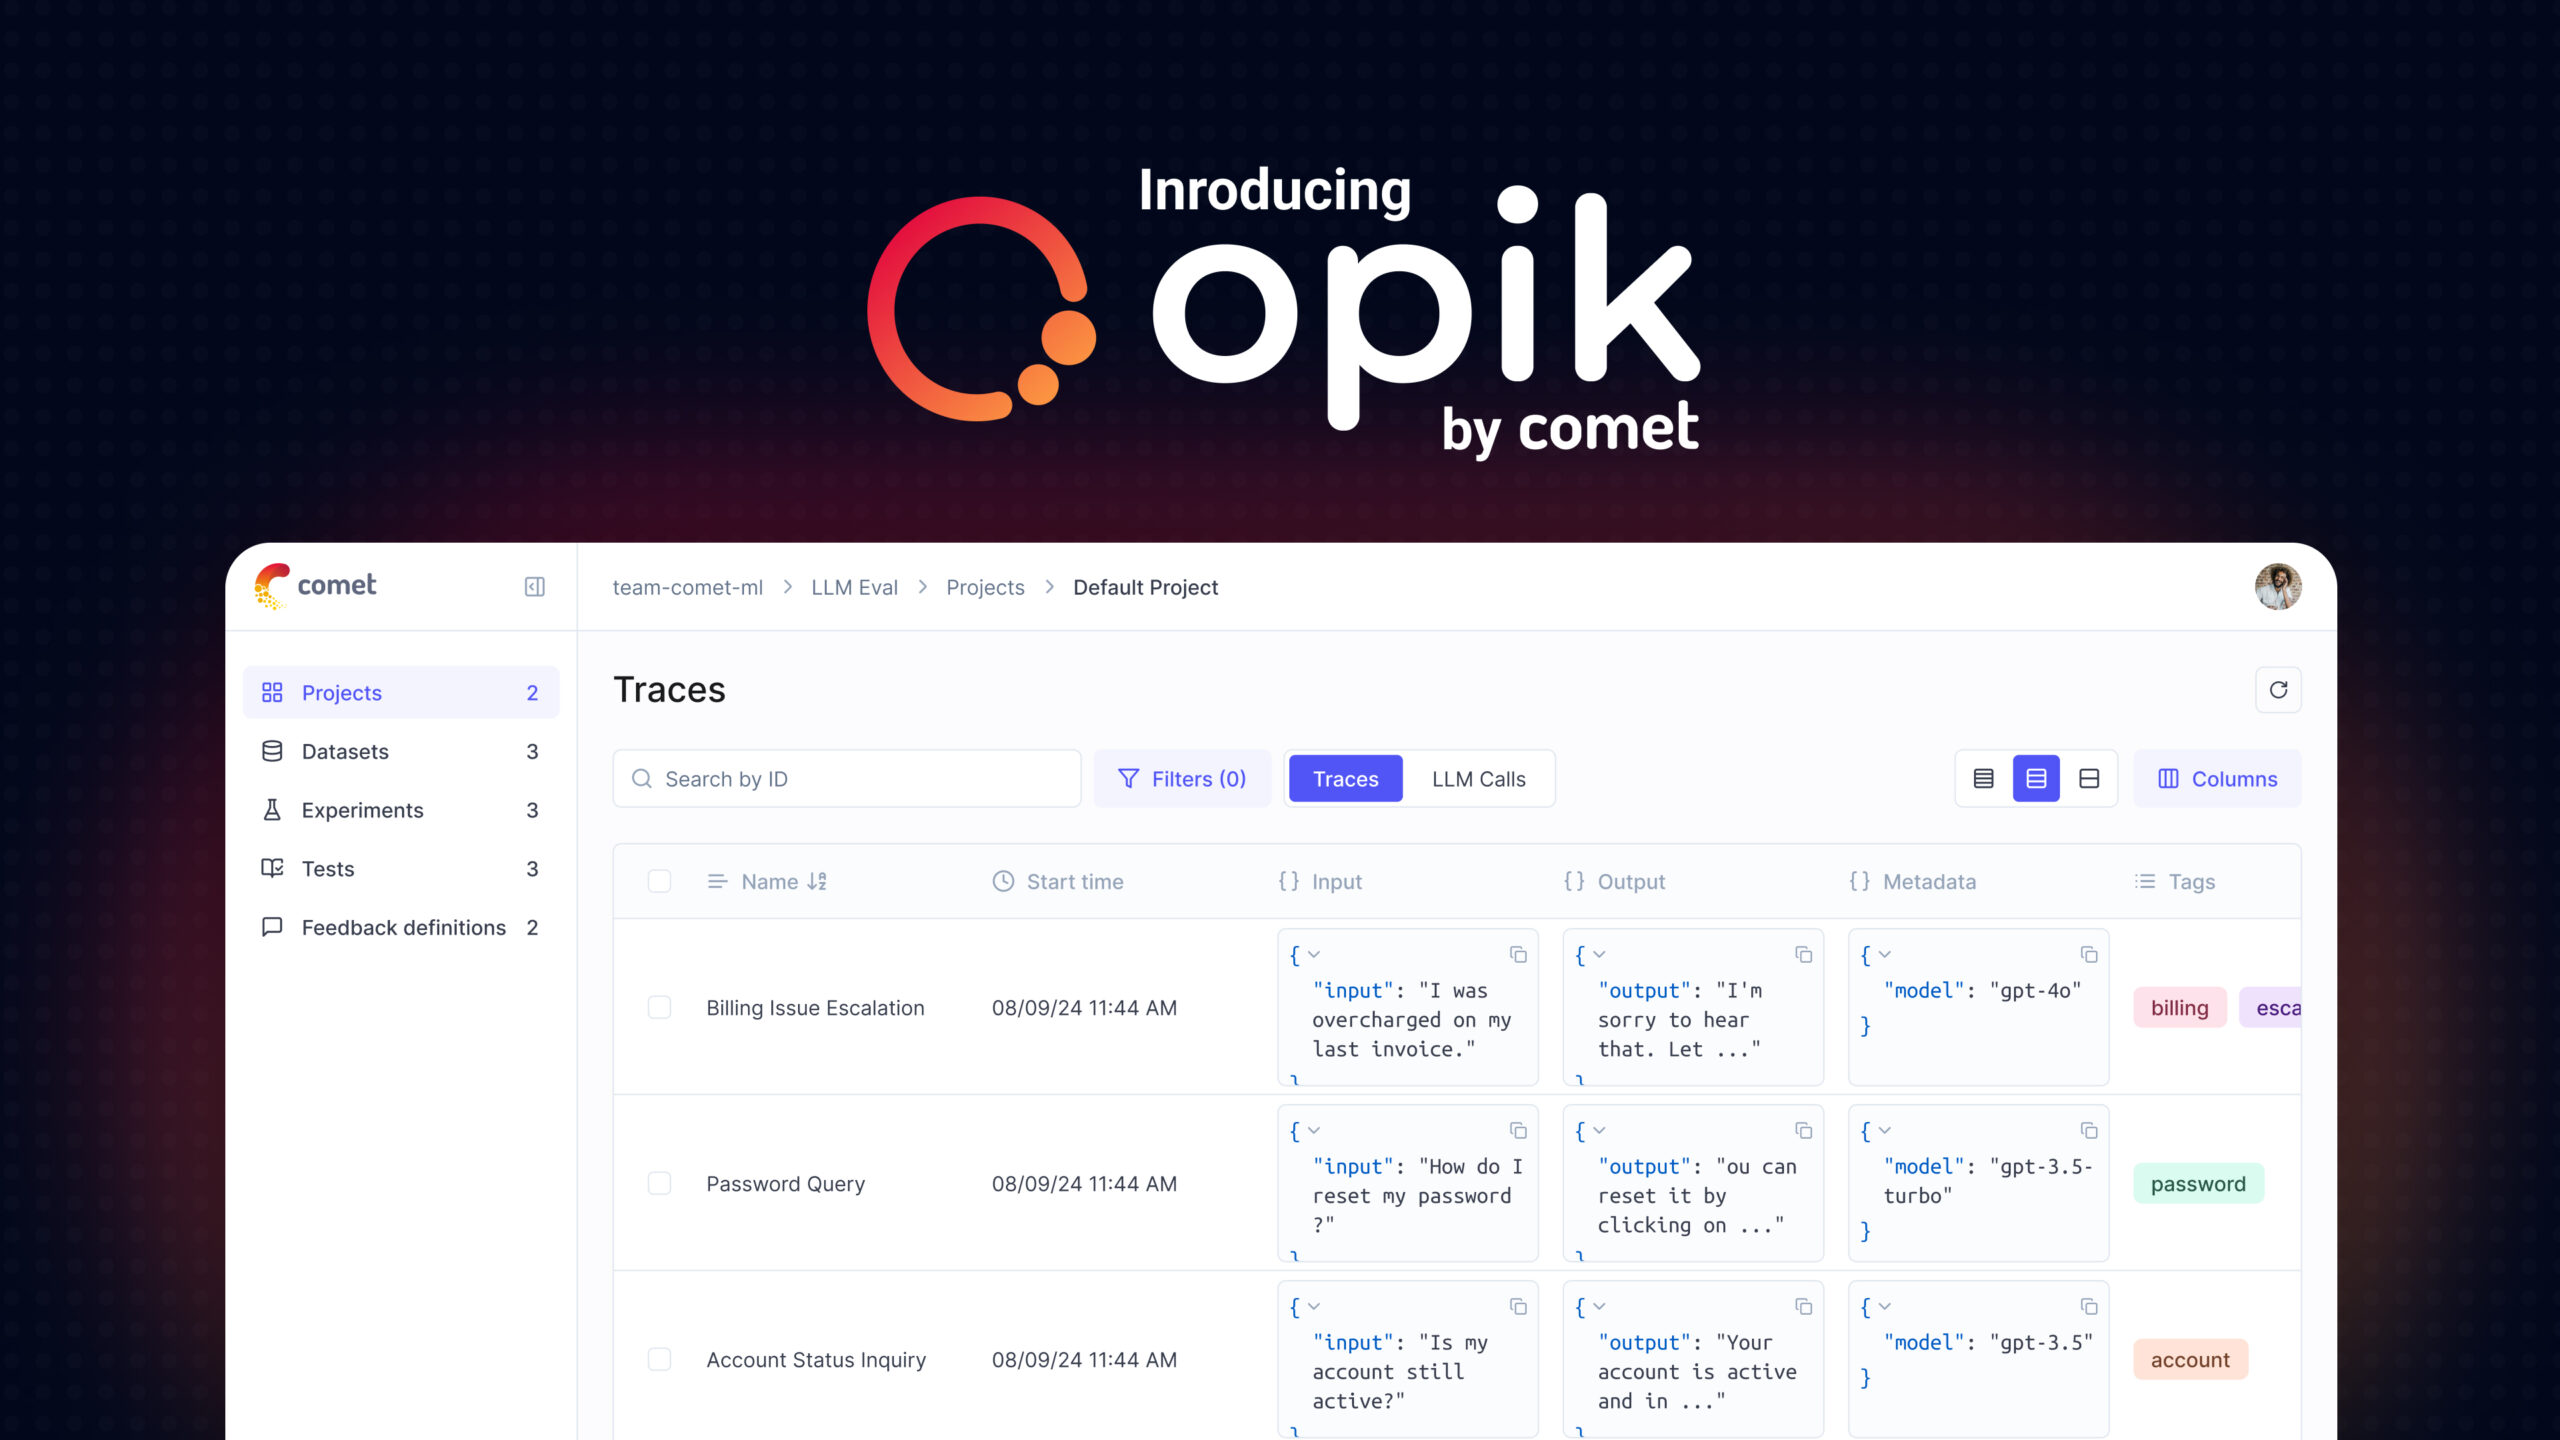
Opik (made by Comet, and released under the permissive Apache-2.0 license) is an open-source tool that gives you that missing record. It captures every call your LLM app makes — the prompt, the retrieved context, the model's reply, how long it took, how many tokens it used — and stores it as a searchable trace you can replay later. On top of that it can automatically score those replies and show the results on dashboards.
Think of Opik as a flight recorder bolted to your AI app. A plane's black box does not fly the plane; it quietly logs every input and reading so that, when something goes wrong, investigators can replay exactly what happened. Opik plays the same role for your model calls: it does not change what your app does, it just records everything so you can understand, debug, and improve it afterward.
Why it matters
Before you ship an LLM feature, a few demo prompts looking good feels like enough. After you ship, reality arrives: thousands of real users ask questions you never tested, costs creep up, latency spikes, and someone reports a hallucinated answer with no way to reproduce it. A tool like Opik exists to close that gap between "it worked on my machine" and "it works in production."
- You can finally debug. When an answer is wrong, you open its trace and see the exact prompt, the retrieved documents, and the raw model output. Often the bug is obvious once you can see it — the retriever pulled the wrong chunk, or a template dropped a variable.
- You can measure quality, not just guess it. Opik can run automated scores over your outputs (for example, was the answer faithful to the retrieved context?), so "is it good?" becomes a number you can track over time instead of a vibe.
- You can watch cost and latency. Every trace records token counts and timing, so you can spot the one slow step or the prompt that quietly tripled your bill — see cost attribution.
- You can compare changes safely. Tweak a prompt or swap a model, re-run it over a fixed test set, and Opik shows you side by side whether scores went up or down before you ship the change.
Who cares? Anyone running an LLM app past the toy stage: teams building RAG systems, AI agents, or chatbots that real people depend on. Being open-source and Apache-2.0 also matters in practice — you can self-host it inside your own infrastructure, which is often a hard requirement when prompts and user data are sensitive.
How it works
Opik has three jobs that build on each other: trace what your app does, evaluate how good the outputs are, and display both on dashboards you can search and compare. Tracing is the foundation — everything else reads from the traces.
Traces and spans
The core data unit is a trace: the full record of one request through your app. Inside a trace are spans — individual steps, nested like a tree. A single chatbot answer might be one trace containing a span for "embed the question," a span for "search the vector database," and a span for "call the model." Each span stores its inputs, outputs, timing, and (for model calls) token usage. This is the same trace-and-span idea used across LLM tracing generally.
You get traces into Opik by instrumenting your code — adding lightweight hooks that report each step. In practice this is small: a decorator on your functions, or a built-in integration that auto-captures calls to common SDKs and frameworks. Your app's logic does not change; Opik just listens in.
import opik
from anthropic import Anthropic

client = Anthropic()

@opik.track  # this function now becomes a span in the trace
def answer(question: str, context: str) -> str:
    prompt = f"Answer using only this context.\n\n{context}\n\nQ: {question}"
    msg = client.messages.create(
        model="claude-sonnet-4-6",
        max_tokens=300,
        messages=[{"role": "user", "content": prompt}],
    )
    return msg.content[0].text

# Each call to answer() now shows up in Opik with its inputs,
# output, latency, and token usage — no extra logging code.
print(answer("What's the refund window?", "Refunds within 30 days."))
Automated evaluation
Recording calls tells you what happened; evaluation tells you whether it was good. Opik can attach metrics to traces. Some metrics are simple code checks (did the JSON parse? does the answer contain a required phrase?). Others use LLM-as-a-judge: a second model reads the output against a rubric and returns a score — useful for fuzzy qualities like helpfulness or faithfulness that no regular expression can capture.
You can run these evals two ways: offline, over a fixed dataset before you ship (this is an experiment), or online, sampling live production traffic to watch quality drift after you ship. The same metric definitions work in both modes.
Dashboards and experiments
Finally, Opik shows everything in a UI: a searchable list of traces you can open and inspect span by span, and experiment views that compare runs side by side. Change a prompt, re-run your test set, and the dashboard tells you which examples improved, which regressed, and by how much — the loop that turns guesswork into measured iteration.
A worked example: debugging a bad answer
Concretely, here is how the three pieces come together when something goes wrong in a support chatbot.
- A user reports the bot gave the wrong refund policy. You search Opik for that conversation and open its trace.
- The trace shows three spans. The model-call span looks fine — but the retrieval span returned a chunk about digital goods, not physical items. The model answered faithfully from bad context. The bug is in retrieval, not the prompt.
- You fix your chunking so the physical-goods policy stays intact, then build a small dataset of similar questions.
- You run that dataset as an offline experiment with a faithfulness metric. Opik shows the score jump from the old run to the new one, and no regressions on the questions that already worked.
- You ship the fix and turn on online sampling so the same metric keeps watching live traffic.
Where Opik fits among the alternatives
Opik is one of several open-source observability tools, and they overlap a lot. The useful distinction is less "which is best" and more "which model — self-host vs managed, dashboard vs neutral pipe — fits your constraints."
| Tool | Made by | Shape |
|---|---|---|
| Opik | Comet | Open-source (Apache-2.0) tracing, evals, and dashboards; self-host or managed |
| Langfuse | Langfuse | Open-source tracing and evals; self-host or managed — the closest comparison |
| Phoenix | Arize | Open-source tracing and evals, built around OpenTelemetry |
What tends to pull people toward Opik specifically: the permissive Apache-2.0 license (fewer restrictions than some copyleft alternatives), a strong focus on evaluation sitting right next to tracing rather than bolted on, and its lineage from Comet, a team with a long background in experiment tracking for machine learning. For a deeper feature-by-feature view of the managed players, see Langfuse vs LangSmith vs Helicone.
Common pitfalls
- Logging everything, looking at nothing. Instrumentation is easy; the value only appears when you actually open traces and act on what evals tell you. A dashboard nobody reads is just storage cost.
- Trusting the judge blindly. LLM-as-a-judge scores are estimates, not ground truth. A judge model has its own biases and can be wrong. Calibrate it against some human-labeled examples before you treat its numbers as gospel.
- Recording sensitive data carelessly. Traces capture full prompts and outputs, which may contain personal or confidential information. Mask or scrub sensitive fields, and lean on the self-host option when data cannot leave your network.
- Tracing 100% of high-volume traffic. At scale, storing every trace gets expensive and noisy. Sample — keep all errors and a fraction of the rest. See trace sampling.
- Evaluating only offline. Passing your test set does not mean production is healthy; real users ask things you never imagined. Combine offline experiments with online sampling on live traffic.
Going deeper
Once tracing and basic evals are in place, the interesting work is in tightening the loop. A few directions worth knowing.
Datasets as a first-class asset. Your most valuable artifact over time is a curated dataset of real, tricky inputs with known-good answers. Opik lets you promote interesting production traces — especially failures — straight into a dataset, so every bug you find permanently becomes a regression test. This is how a golden dataset grows organically instead of being written from scratch.
Online metrics and production health. Beyond per-answer scores, you'll want app-level signals: latency percentiles, cost per request, and error rates over time — the production metrics that tell you whether the system is healthy, not just whether one answer was good. Pair these with explicit user feedback (thumbs up/down) logged onto the trace, which is the cheapest high-quality label you will ever get.
Agents make tracing essential, not optional. A single agent task can fan out into dozens of model calls and tool uses. A flat log is unreadable; the nested span tree is the only sane way to see what an agent actually did, which branch it took, and where it looped. The more autonomous your system, the more the trace is your primary debugging surface.
The honest limits. Observability shows you what happened and helps you measure whether it was good — it does not decide good for you. You still have to define metrics that match what users care about, validate that your judges agree with humans, and resist the temptation to optimize a score that does not reflect real quality. The tool removes the blindness; the judgment is still yours.
FAQ
What is Opik used for?
Opik is an open-source tool for observing LLM and agent apps. You use it to trace every model call (capturing prompts, context, outputs, latency, and token usage), run automated evaluations on those outputs, and view everything on searchable dashboards so you can debug, measure quality, and compare changes.
Is Opik free and open-source?
Yes. Opik is released by Comet under the permissive Apache-2.0 license, so you can self-host it inside your own infrastructure for free. Comet also offers a managed (hosted) version if you would rather not run it yourself.
Opik vs Langfuse — what's the difference?
Both are open-source LLM observability tools offering tracing, evaluations, and dashboards, with self-host and managed options, so they overlap heavily. Opik (from Comet) uses the permissive Apache-2.0 license and puts strong emphasis on evaluation. The right choice usually comes down to licensing, self-host needs, and which evaluation workflow fits your team rather than a single missing feature.
What is a trace in Opik?
A trace is the complete record of one request through your app. Inside it are spans — the individual steps, nested like a tree (for example: embed the question, search the vector database, call the model). Each span stores its inputs, outputs, timing, and token usage, so you can replay exactly what happened later.
Does Opik support LLM-as-a-judge evaluation?
Yes. Alongside simple code-based checks, Opik can score outputs using LLM-as-a-judge, where a second model grades a response against a rubric. This is useful for fuzzy qualities like helpfulness or faithfulness. Treat these scores as estimates and calibrate the judge against human-labeled examples before trusting it.